
Excel is a foundation for many business users, especially in finance, planning, and analysis. The SAP Analytics Cloud (SAC) Excel Add-in blends the flexibility of Excel with the power, governance, and real-time data of SAC. This integration enables teams to perform what-if analysis directly in Excel while maintaining security, validation, and collaboration through SAC.
Top 7 Features in the SAC Excel Add-In
Open SAC WEB Story Table in Excel
What it does:
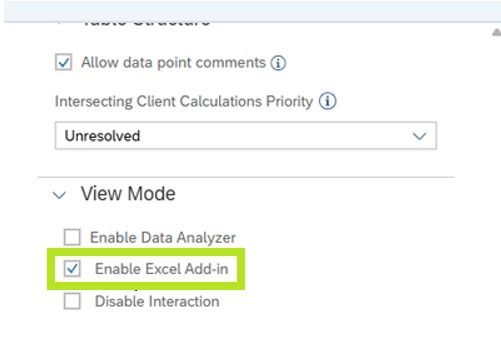
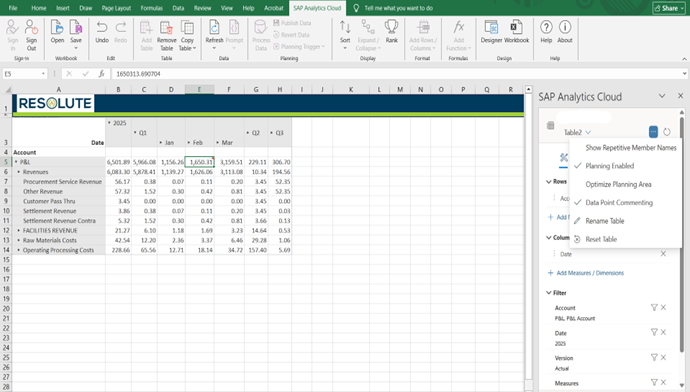
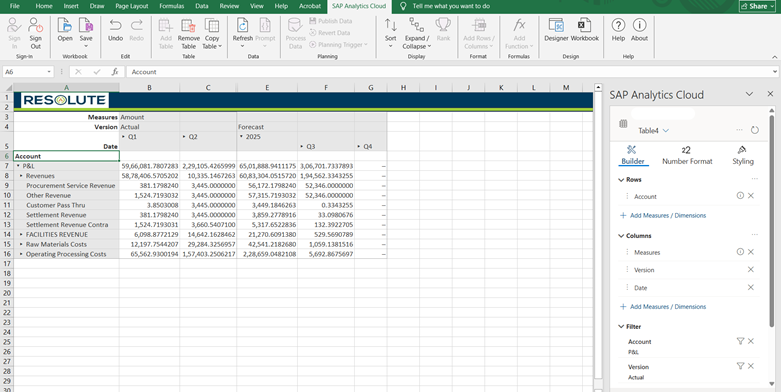
- With newer versions (2025 QRC Q4 Release), you can take a table from an SAC story and open it directly in Excel. But this isn’t just a static snapshot: the table in Excel retains the data source, structure (dimensions, measures, rows/columns), filters, and variables from the story.
Technical detail:
- To use this, the “Open in Excel Add-in” option needs to be enabled in the story’s table properties (Builder Panel). The story must use the “new table experience.”
Screenshot
In-Cell Comments Synced with SAC (Data Point Comments)
What it does:
- You can add comments to specific data cells in Excel, and those comments sync back to SAC. That means collaboration on cell-level insights or anomalies, tracked centrally.
Technical detail:
- The add-in introduces a formula that allows retrieving the last comment in a thread programmatically.
Screenshots
- Enable data point comments from the Table Option in Designer Pane
- This will enable a comment widget to add comments
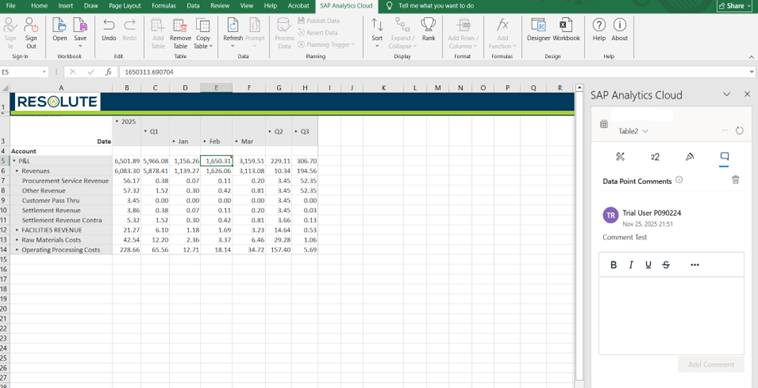
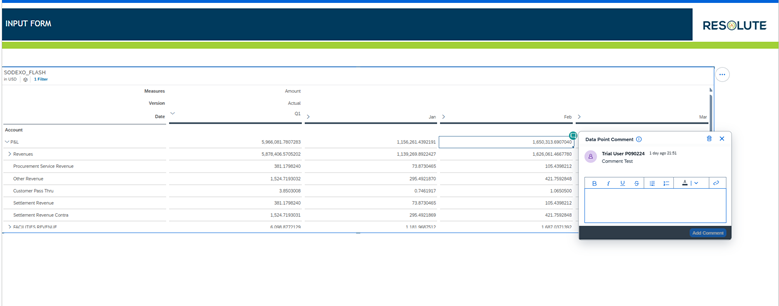
- The comment written in Excel is also visible on the web.
Support for New Cell-Based Custom Formulas in Excel
What it does:
- The SAC Excel Add-in supports new custom formulas like SAP.ASYMMETRIC, allowing users to create flexible and asymmetric reports directly in Excel.
Technical detail:
- It provides more control over how rows, columns, and filters are arranged, helping you design report layouts exactly the way you need.
Screenshot:
Merged Actual and Forecast data displayed together using the SAC Excel Add-in.
Highly Formatted Reporting with Cell-Based Formulas
What it does:
- You can create clean, professional-looking reports in Excel while still connected to SAC data.
Technical detail:
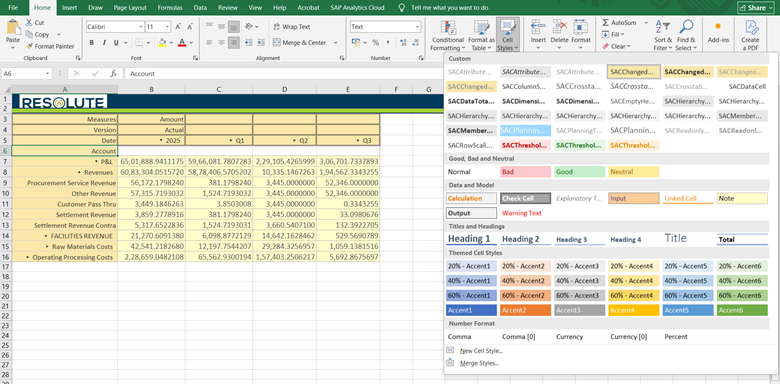
- Cell-based formulas allow you to keep your own formatting — colors, merged cells, headings — even after the data refreshes. Perfect for financial statements, summaries, and board-ready presentations.
Screenshot
Styling & Thresholds for Cells
What it does:
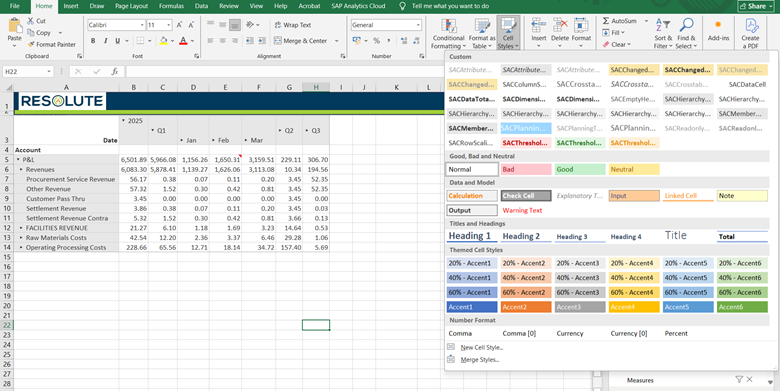
- You can style cells in Excel tables (colors, format) based on business logic or thresholds. There are predefined SAC styles, and you can even create custom cell styles.
Technical detail:
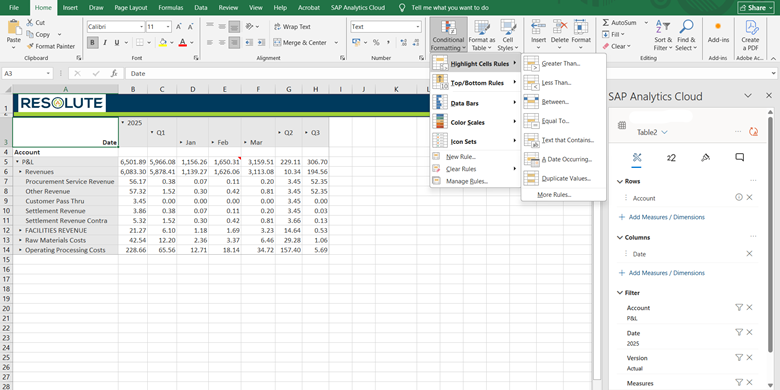
- Style rules created in SAC or Excel help maintain consistency (e.g., using corporate colors) and make critical values visually stand out.
Screenshot
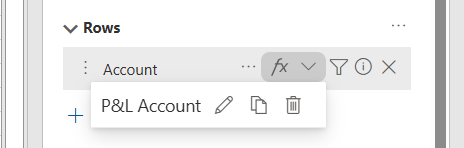
Calculated Measures (Restricted Measures Support)
What it does:
- You can define restricted measures directly in Excel as calculated measures, using the same logic as in SAC web stories.
Technical detail:
- Currently, only value-based restrictions are supported, not dynamic date restrictions (e.g., “current period”). But you can define and edit these measures in Excel.
Screenshot
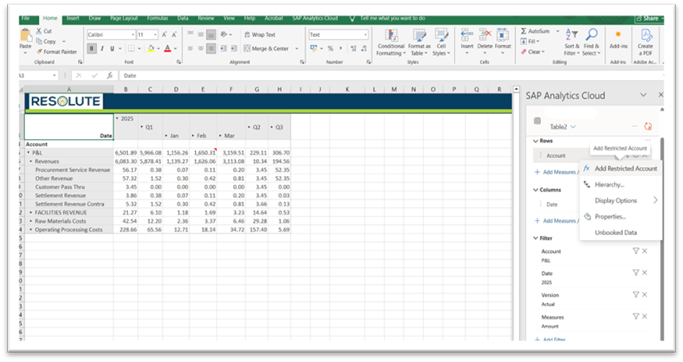
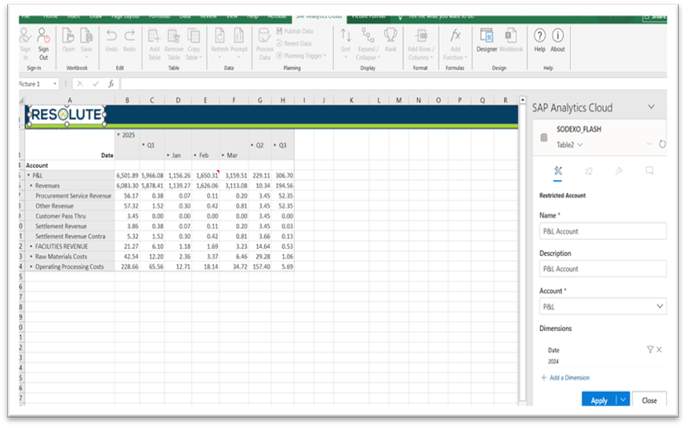
- After creating the first restricted measure for a data source, you have the option Manage Restricted Measures in the builder panel to edit, duplicate, or delete restricted measures.
Planning Input Templates
What it does:
- Users can enter and update planning data directly in Excel, and the values sync with SAC models.
Technical detail:
- Excel feels familiar, and at the same time, SAC ensures validation, version control, publish/revert, and security.
Screenshot

Tips & Tricks
- Build reusable templates for planning and reporting.
- Use cell comments to maintain context for data changes.
- Apply consistent styling for professional, readable dashboards.
- Use restricted measures to customize analysis.
- Train users on SAC governance features.
- Leverage drag-and-drop builder features for faster report creation.
- Copy templates across workbooks to maintain consistency.
Conclusion
With these seven features, the SAC Excel Add-in makes planning and reporting faster, easier, and more accurate. It brings SAC’s power into Excel, helping users work efficiently and stay aligned with real-time data. Overall, it provides a simple and reliable way to manage analytics and planning in one place.